3QFY18 Result Update | HFC
January 27, 2018
Dewan Housing Finance
BUY
CMP
`596
Performance Highlights
Target Price
`720
Investment Period
12 months
Particulars (` cr)
3QFY18
2QFY18
% chg (qoq)
3QFY17
% chg (yoy)
NII
626
601
4.2
516
21.3
Stock Info
Pre-prov. profit
563
542
3.9
417
35.0
Sector
HFC
PAT
307
294
4.4
245
25.2
Market Cap (` cr)
18,698
Source: Company, Angel Research
Beta
1.6
52 Week High / Low
678/277.4
Dewan Housing Finance Ltd (DHFL) came out with yet another quarter of good
Avg. Daily Volume
3,41,668
results for Q3FY2018. AUM growth of 29.4% and PAT growth of 25.2% was in-
Face Value (`)
10
line with expectations. NIM on AUM marginally declined by 7bps to 2.56% qoq,
BSE Sensex
36,050
as the incremental yield on disbursement was lower.
Nifty
11,069
Reuters Code
DWNH.BO
Loan growth remained decent: DHFL reported a 29.4% yoy growth in AUM to `
Bloomberg Code
DEWH.IN
1,01,286cr. Home loan/Loan against property/Project fin/SME segments grew
18/49/55/72% yoy respectively. The disbursements remained strong growing by
Shareholding Pattern (%)
26% yoy at `6,215cr. 17% of the AUM is off book. Entire SME book has been
Promoters
39.2
securitised.
MF / Banks / Indian Fls
10.2
FII / NRIs / OCBs
20.8
Asset quality remained stable: DHFL has maintained stable asset quality over the
Indian Public / Others
29.8
last few quarters. During the current quarter, GNPA remained stable at 0.96%.
On a yoy basis, provision was up 122%, however looking at the strong growth in
Abs. (%)
3m
1yr
3yr
non individual loan book, where the regulatory requirements of provisions are
Sensex
9.0
33.4
23.1
high; it appears the provisioning growth is reasonable.
DHFL
(3.3)
108.2
139.4
Marginal decline in NIM: Yield has come down in the last one quarter due to
overall competition, and hence the calculated NIM was lower at 2.56% compared
to 2.64% in Q2FY18. We believe increasing exposure to the high yielding project
loans and LAP portfolio will enable it in maintaining NIM above 2.6% level.
Outlook and valuation: We expect the company to post a healthy loan book
CAGR of 23% over FY2017-20E, which is likely to translate in earnings CAGR of
26%, over the same period. At the current level, the stock is valued at 1.7x
FY2020E ABV. We maintain BUY on the stock, and retain our target price of `720.
Key financials (standalone)
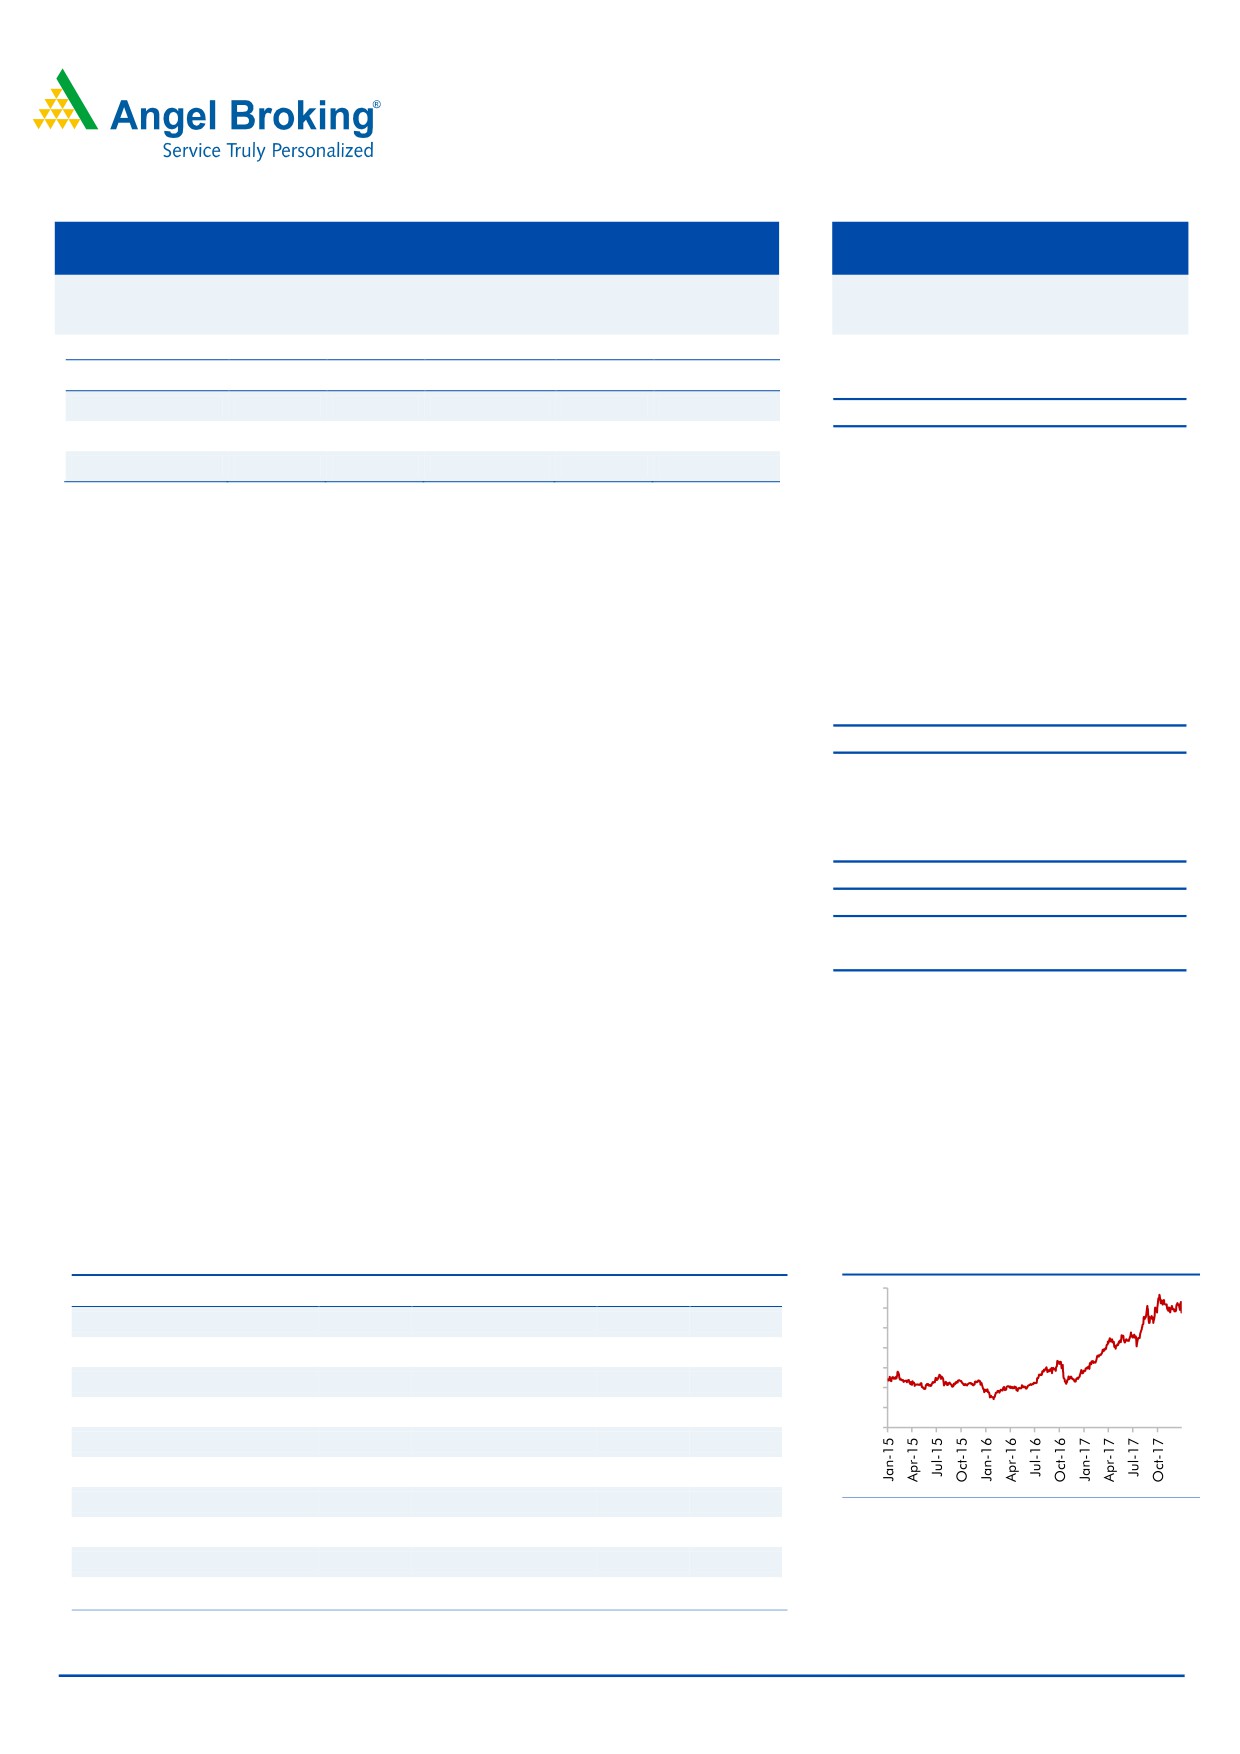
3-Year Daily Price Chart
Y/E March (` cr)
FY16
FY17
FY18E
FY19E
FY20E
700
600
NII
1,481
1,859
2,279
2,927
3,440
500
400
% chg
17.8
25.5
22.6
28.4
17.5
300
Net profit
729
927
1,171
1,556
1,861
200
% chg
17.4
27.1
26.3
32.8
19.6
100
0
NIM (%)
2.4
2.3
2.4
2.7
2.6
EPS (`)
25.0
29.6
37.4
49.7
59.4
P/E (x)
23.8
20.1
15.9
12.0
10.0
Source: Company, Angel Research
P/ABV (x)
3.8
2.5
2.2
2.0
1.7
RoA (%)
1.3
1.3
1.3
1.5
1.5
RoE (%)
15.3
14.4
13.8
16.2
17.0
Jaikishan Parmar
022 - 3935 7600 Ext: 6810
Source: Source: Company, Angel Research; Note: CMP as of January 25, 2018
Please refer to important disclosures at the end of this report
1
Dewan Housing Finance| 3QFY18 Result Update
Exhibit 1: 3QFY2018 performance (standalone)
3QFY16
4QFY16
1QFY17
2QFY17
3QFY17 4QFY17 1QFY18 2QFY18 3QFY18
% YoY
% QoQ
Interest Income
1,846
1,916
1,932
2,123
2,316
2,283
2,353
2,504
2,520
8.8
0.6
Interest Expenses
1,420
1,479
1,475
1,631
1,800
1,747
1,787
1,903
1,894
5.2
-0.5
NII
426
438
457
492
516
536
566
601
626
21.3
4.2
Other Income
39
50
27
45
51
95
55
111
114
123.5
2.7
Total Income
465
488
484
537
567
631
621
712
740
30.5
3.9
Operating Expenses
130
150.1
130
133
143
168
151
164
170
18.9
3.7
Cost / Income %
28.0
30.8
26.9
24.8
25.2
26.6
24.3
23.0
23.0
Depreciation
7
5
6
7
7
3
6
6
7
4.3
16.7
PPP
328
333
348
397
417
459
464
542
563
35.0
3.9
Provisions
48
50
45
45
45
83
83
107
100
122.2
-6.5
PBT
280
283
303
352
372
376
381
435
463
24.4
6.4
Tax
95
93
102
120
127
127
120
141
156
22.9
10.6
Tax Rate %
34
33
34
34
34
34
32
32
34
PAT
185
190
201
232
245
249
260
294
307
25.2
4.4
Extra Ordinary Gain
0
0
0
0
0
1,969
0
0
0
Reported PAT
185
190
201
232
245
2,218
260
294
307
25.2
4.4
Source: Company, Angel Research
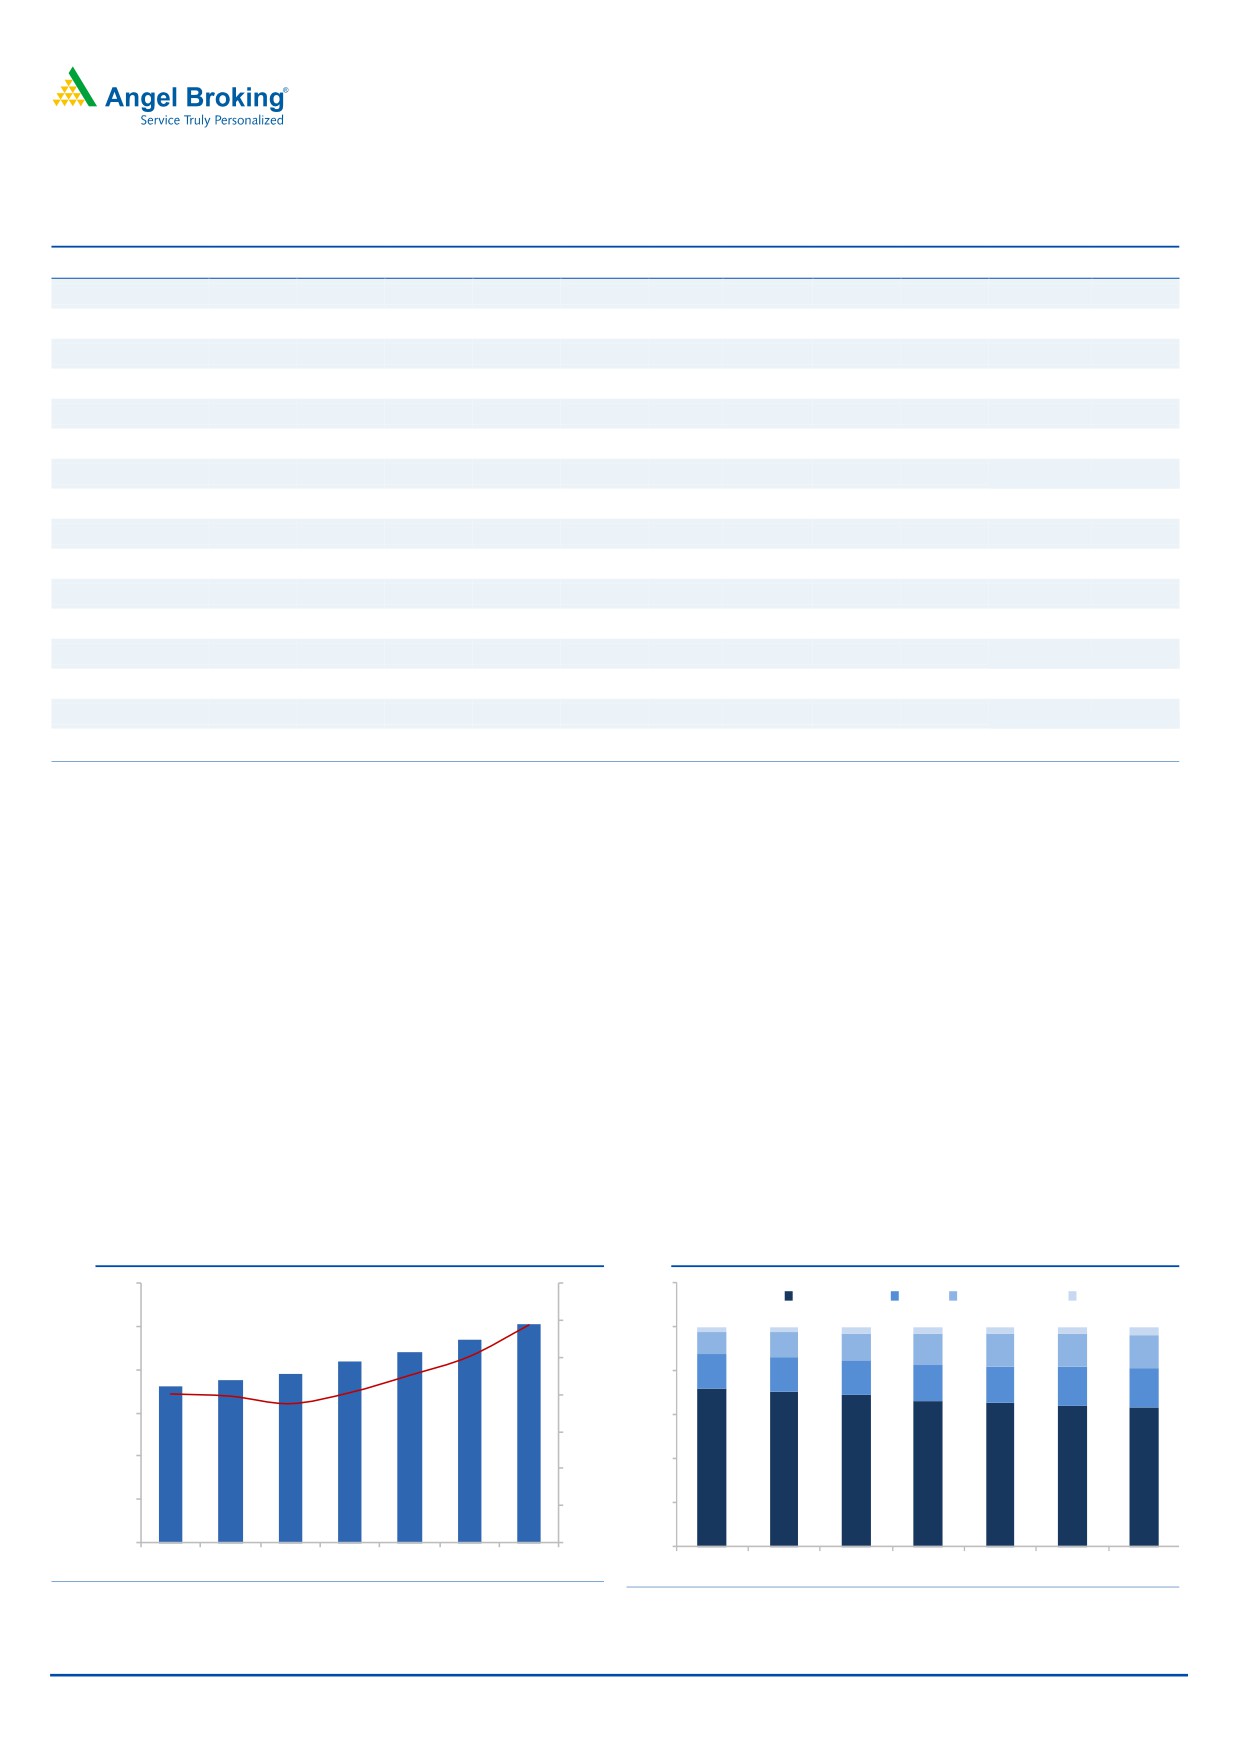
Loan growth remained decent: DHFL reported a 29.4% yoy growth in AUM to
`1,01,286cr. HL/LAP/PF/SME segments grew
18/49/55/72% yoy. The
disbursements remained strong growing by 26% yoy at ` 6,215cr. 17% of the
AUM is off book. Entire SME book has been securitised.
Project loans growing faster than overall loan: Loans to individuals grew by 18.3%
yoy (63% of the AUM). DHFL continued to aggressively expand its non individual
loan book, primarily the loans to projects, which went up by 55.2% yoy accounting
for ~15% of the AUM compared to 13% at the end of Q3FY17. We believe DHFL
will continue to expand the high yielding developer loan book in the near term.
Exhibit 2: AUM (`cr), yoy growth
Exhibit 3: Product mix
1,20,000
35%
120%
Home Loans
LAP
Project Finance
Others
1,01,286
1,00,000
94,089
30%
100%
3%
3%
3%
3%
3%
3%
88,236
4%
83,560
10%
12%
29%
13%
14%
15%
15%
15%
78,296
25%
75,223
80,000
72,012
80%
16%
16%
25%
16%
17%
17%
18%
18%
20%
23%
60,000
60%
20%
20%
20%
19%
15%
40,000
40%
10%
72%
70%
69%
66%
66%
64%
63%
20,000
5%
20%
-
0%
0%
Q1FY17 Q2FY17 Q3FY17 Q4FY17 Q1FY18 Q2FY18 Q3FY18
Q1FY17
Q2FY17
Q3FY17
Q4FY17
Q1FY18
Q2FY18
Q3FY18
Source: Company, Angel Research
Source: Company, Angel Research
January 27, 2018
2
Dewan Housing Finance| 3QFY18 Result Update
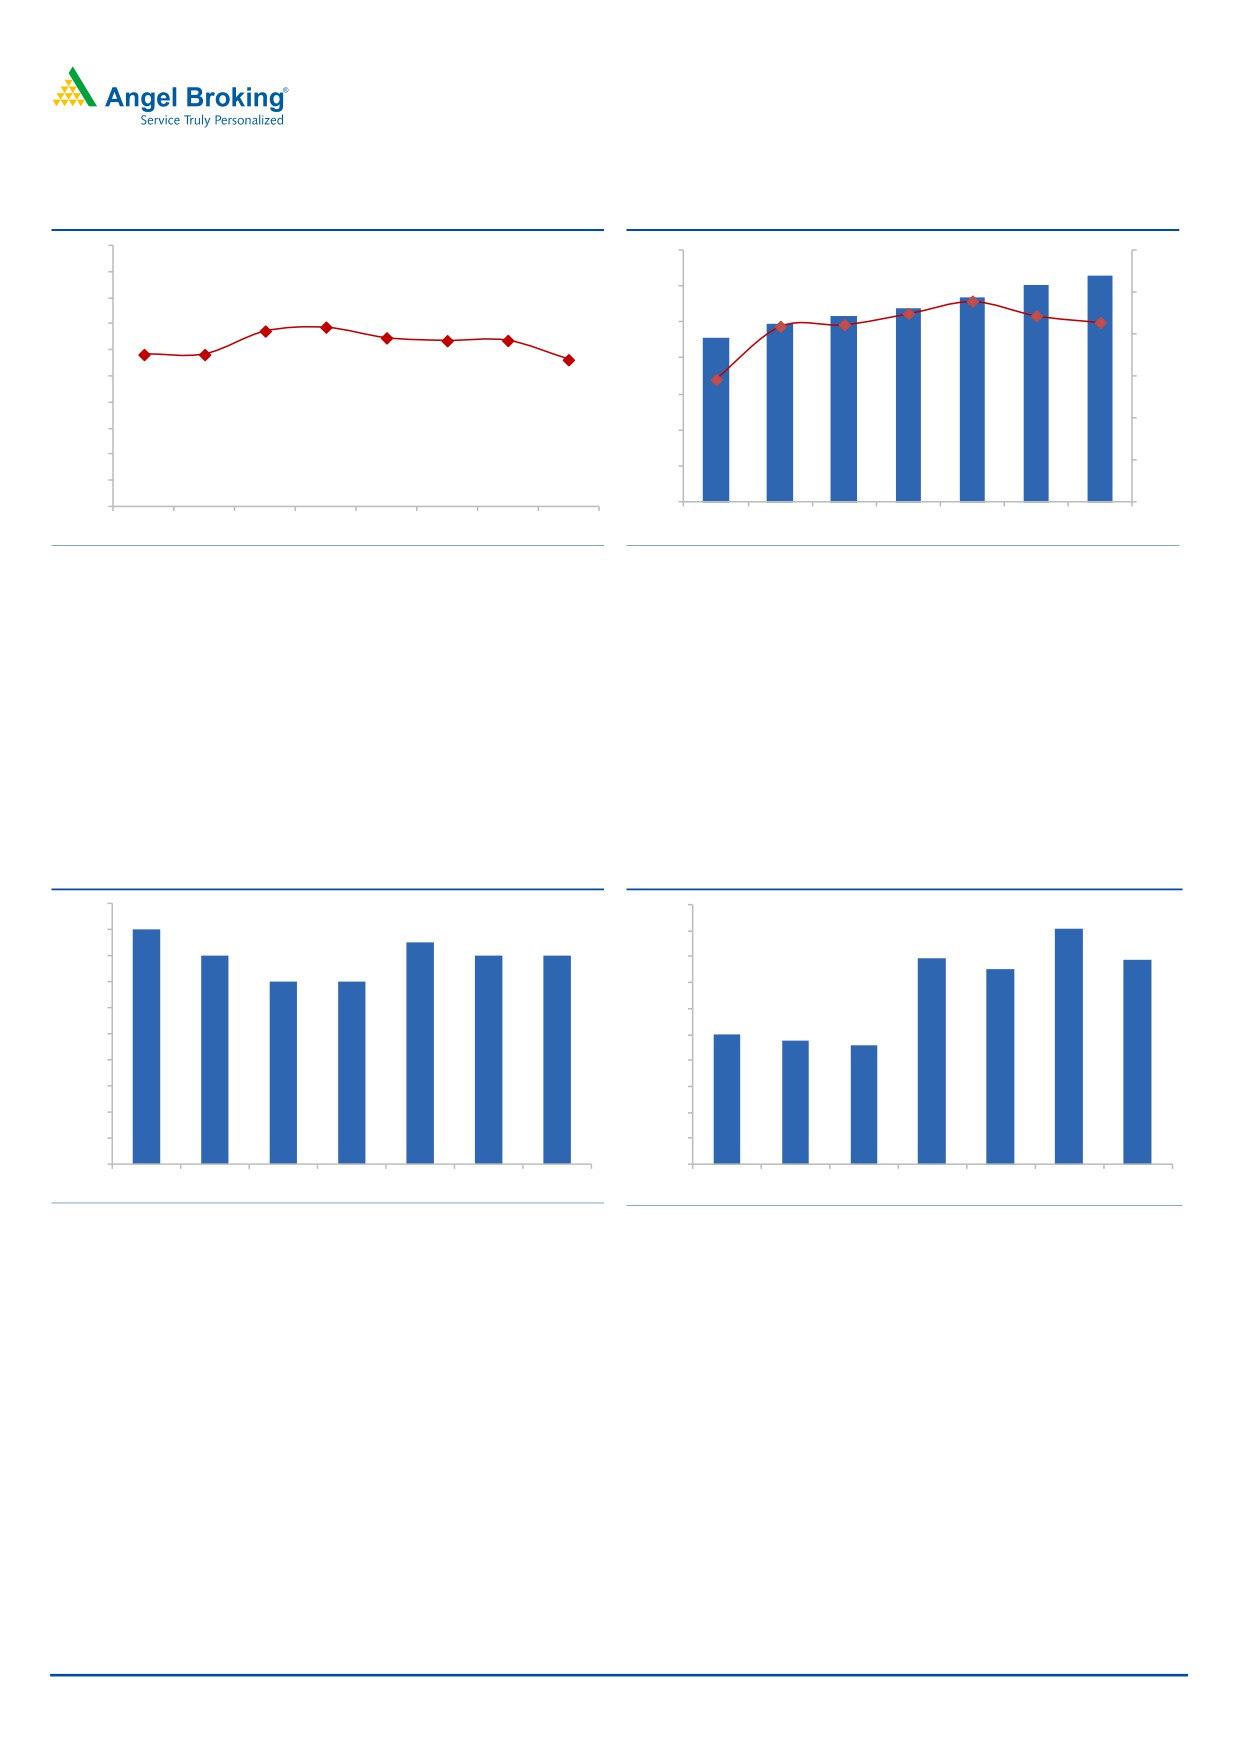
Exhibit 4: Marginal decline in NIM
Exhibit 5: NII (` cr) growth trend remains healthy
3.00%
700
30%
626
2.90%
601
566
600
536
25%
2.80%
516
2.67%
2.69%
492
2.65%
2.64%
2.64%
457
2.70%
500
24%
2.58%
2.58%
20%
2.56%
22%
22%
2.60%
21%
21%
21%
400
2.50%
15%
300
2.40%
15%
10%
2.30%
200
2.20%
5%
100
2.10%
2.00%
-
0%
4QFY16 1QFY17 2QFY17 3QFY17 4QFY17 1QFY18 2QFY18 3QFY18
1QFY17
2QFY17
3QFY17
4QFY17
1QFY18
2QFY18
3QFY18
Source: Company, Angel Research
Source: Company, Angel Research
Asset quality remained stable: DHFL has maintained stable asset quality over the
last few quarters. During the current quarter, GNPA remained stable at 0.96%..
On a yoy basis provision was up 122%, however looking at the strong growth in
non individual loan book, where the regulatory requirements of provisions are
high, it appears the provisioning growth is reasonable.
Exhibit 6: Stable asset quality
Exhibit 7: Credit cost
1.00%
0.50%
0.98%
0.45%
0.98%
0.97%
0.45%
0.96%
0.96%
0.96%
0.40%
0.39%
0.96%
0.40%
0.38%
0.94%
0.94%
0.94%
0.35%
0.92%
0.30%
0.25%
0.24%
0.23%
0.90%
0.25%
0.88%
0.20%
0.86%
0.15%
0.84%
0.10%
0.82%
0.05%
0.80%
0.00%
1QFY17 2QFY17 3QFY17 4QFY17 1QFY18 2QFY18 3QFY18
1QFY17
2QFY17
3QFY17
4QFY17
1QFY18
2QFY18
3QFY18
Source: Company, Angel Research
Source: Company, Angel Research
Outlook and valuation
Outlook and valuation: We expect the company to post a healthy loan book CAGR
of 23% over FY2017-20E, which is likely to translate in earnings CAGR of 26%
over the same period. At the current level, the stock is valued at 1.7x FY2020E
ABV. We maintain BUY on the stock, and retain our target price of `720
January 27, 2018
3
Dewan Housing Finance| 3QFY18 Result Update
Income statement (standalone)
Y/E March (` cr)
FY16
FY17
FY18E
FY19E
FY20E
Net Interest Income
1,481
1,859
2,279
2,927
3,440
- YoY Growth (%)
17.8
25.5
22.6
28.4
17.5
Other Income
329
345
397
456
525
- YoY Growth (%)
24.0
4.7
15.0
15.0
15.0
Operating Income
1,810
2,204
2,676
3,383
3,965
- YoY Growth (%)
18.9
21.8
21.4
26.4
17.2
Operating Expenses
533
583
644
711
784
- YoY Growth (%)
12.4
9.5
10.4
10.5
10.3
Pre - Provision Profit
1,277
1,620
2,032
2,672
3,181
- YoY Growth (%)
21.9
26.9
25.4
31.5
19.0
Provision and Contingencies
175
218
284
350
403
- YoY Growth (%)
66.7
24.6
30.2
23.3
15.0
Profit Before Tax
1,102
1,402
1,748
2,322
2,778
- YoY Growth (%)
16.9
27.2
24.7
32.8
19.6
Provision for Taxation
373
475
577
766
917
- as a % of PBT
33.8
33.9
33.0
33.0
33.0
PAT
729
927
1,171
1,556
1,861
- YoY Growth (%)
17.4
27.1
26.3
32.8
19.6
Exception Item
-
1,969
-
-
-
Reported PAT
729
2,896
1,171
1,556
1,861
Source:
Balance sheet (standalone)
Y/E March (` cr)
FY16
FY17
FY18E
FY19E
FY20E
Share Capital
292
313
313
313
313
Reserve & Surplus
4,600
7,683
8,634
9,897
11,392
Net Worth
4,892
7,996
8,947
10,210
11,705
Borrowings
51,556
71,023
83,807
1,00,568
1,20,682
- Growth (%)
27.3
37.8
18.0
20.0
20.0
Other Liabilities & Provisions
11,405
13,280
6,385
9,122
12,672
Total Liabilities
67,853
92,298
99,139
1,19,901
1,45,058
Cash & Bank Balance
3,408
3,430
3,499
3,569
3,640
Investments
893
13,535
1,995
2,545
3,097
Advances
61,775
72,096
90,120
1,09,947
1,34,135
- Growth (%)
21.0
16.7
25.0
22.0
22.0
Fixed Assets
781
843
891
944
1,000
Other Assets
996
2,394
2,634
2,897
3,187
Total Assets
67,853
92,298
99,139
1,19,901
1,45,058
- Growth (%)
24.2
36.0
7.4
20.9
21.0
January 27, 2018
4
Dewan Housing Finance| 3QFY18 Result Update
Key Ratios
Y/E March
FY16
FY17
FY18E
FY19E
FY20E
Profitability ratios (%)
NIMs ( Calculated)
2.4
2.3
2.4
2.7
2.6
Cost to Income ratio
29.4
26.5
24.1
21.0
19.8
Cost to Asset ratio
0.9
0.7
0.7
0.6
0.6
ROA
1.3
1.3
1.3
1.5
1.5
ROE
15.3
14.4
13.8
16.2
17.0
CAR %
16.7
19.3
17.0
15.0
14.0
Asset Quality
Gross NPAs (%)
0.9
0.9
1.0
1.0
1.0
Net NPAs (%)
0.6
0.6
0.6
0.6
0.6
Credit Cost (%)
0.3
0.3
0.4
0.4
0.3
Provision coverage
38
38
37
40
40
Per Share Data (`)
EPS
25.0
29.6
37.4
49.7
59.4
BV
168
255
286
326
374
ABVPS
155
242
268
305
348
DPS
8.0
4.0
6.0
8.0
10.0
Valuation Ratios
PER (x)
23.8
20.1
15.9
12.0
10.0
P/BVPS (x)
3.5
2.3
2.1
1.8
1.6
P/ABVPS (x)
3.8
2.5
2.2
2.0
1.7
Dividend Yield
1.3
0.7
1.0
1.3
1.7
DuPont Analysis
Interest Income
11.4
10.6
10.4
10.9
10.7
Interest Expenses
9.0
8.3
8.0
8.2
8.1
NII
2.4
2.3
2.4
2.7
2.6
Other Income
0.5
0.4
0.4
0.4
0.4
Total Income
3.0
2.8
2.8
3.1
3.0
Operating Expenses
0.9
0.7
0.7
0.6
0.6
PPP
2.1
2.0
2.1
2.4
2.4
Provisions
0.3
0.3
0.3
0.3
0.3
PBT
1.8
1.8
1.8
2.1
2.1
Tax
0.6
0.6
0.6
0.7
0.7
ROA
1.2
1.2
1.2
1.4
1.4
Leverage
12.9
12.4
11.3
11.4
12.1
ROE
15.3
14.4
13.8
16.2
17.0
January 27, 2018
5
Dewan Housing Finance| 3QFY18 Result Update
Research Team Tel: 022 - 39357800
DISCLAIMER
Angel Broking Private Limited (hereinafter referred to as “Angel”) is a registered Member of National Stock Exchange of India Limited,
Bombay Stock Exchange Limited and Metropolitan Stock Exchange Limited. It is also registered as a Depository Participant with CDSL
and Portfolio Manager and Investment Adviser with SEBI. It also has registration with AMFI as a Mutual Fund Distributor. Angel Broking
Private Limited is a registered entity with SEBI for Research Analyst in terms of SEBI (Research Analyst) Regulations, 2014 vide
registration number INH000000164. Angel or its associates has not been debarred/ suspended by SEBI or any other regulatory
authority for accessing /dealing in securities Market. Angel or its associates/analyst has not received any compensation / managed or
co-managed public offering of securities of the company covered by Analyst during the past twelve months.
This document is solely for the personal information of the recipient, and must not be singularly used as the basis of any investment
decision. Nothing in this document should be construed as investment or financial advice. Each recipient of this document should make
such investigations as they deem necessary to arrive at an independent evaluation of an investment in the securities of the companies
referred to in this document (including the merits and risks involved), and should consult their own advisors to determine the merits and
risks of such an investment.
Reports based on technical and derivative analysis center on studying charts of a stock's price movement, outstanding positions and
trading volume, as opposed to focusing on a company's fundamentals and, as such, may not match with a report on a company's
fundamentals. Investors are advised to refer the Fundamental and Technical Research Reports available on our website to evaluate the
contrary view, if any
The information in this document has been printed on the basis of publicly available information, internal data and other reliable
sources believed to be true, but we do not represent that it is accurate or complete and it should not be relied on as such, as this
document is for general guidance only. Angel Broking Pvt. Limited or any of its affiliates/ group companies shall not be in any way
responsible for any loss or damage that may arise to any person from any inadvertent error in the information contained in this report.
Angel Broking Pvt. Limited has not independently verified all the information contained within this document. Accordingly, we cannot
testify, nor make any representation or warranty, express or implied, to the accuracy, contents or data contained within this document.
While Angel Broking Pvt. Limited endeavors to update on a reasonable basis the information discussed in this material, there may be
regulatory, compliance, or other reasons that prevent us from doing so.
This document is being supplied to you solely for your information, and its contents, information or data may not be reproduced,
redistributed or passed on, directly or indirectly.
Neither Angel Broking Pvt. Limited, nor its directors, employees or affiliates shall be liable for any loss or damage that may arise from
or in connection with the use of this information.
Disclosure of Interest Statement
Dewan Housing
1. Analyst ownership of the stock
No
2. Angel and its Group companies ownership of the stock
No
3. Angel and its Group companies' Directors ownership of the stock
No
4. Broking relationship with company covered
No
Note: We have not considered any Exposure below ` 1 lakh for Angel, its Group companies and Directors
Ratings (Based on expected returns
Buy (> 15%)
Accumulate (5% to 15%)
Neutral (-5 to 5%)
over 12 months investment period):
Reduce (-5% to -15%)
Sell (< -15)
January 27, 2018
6